
Business statistics overview
KPIs and trends for the entire business.
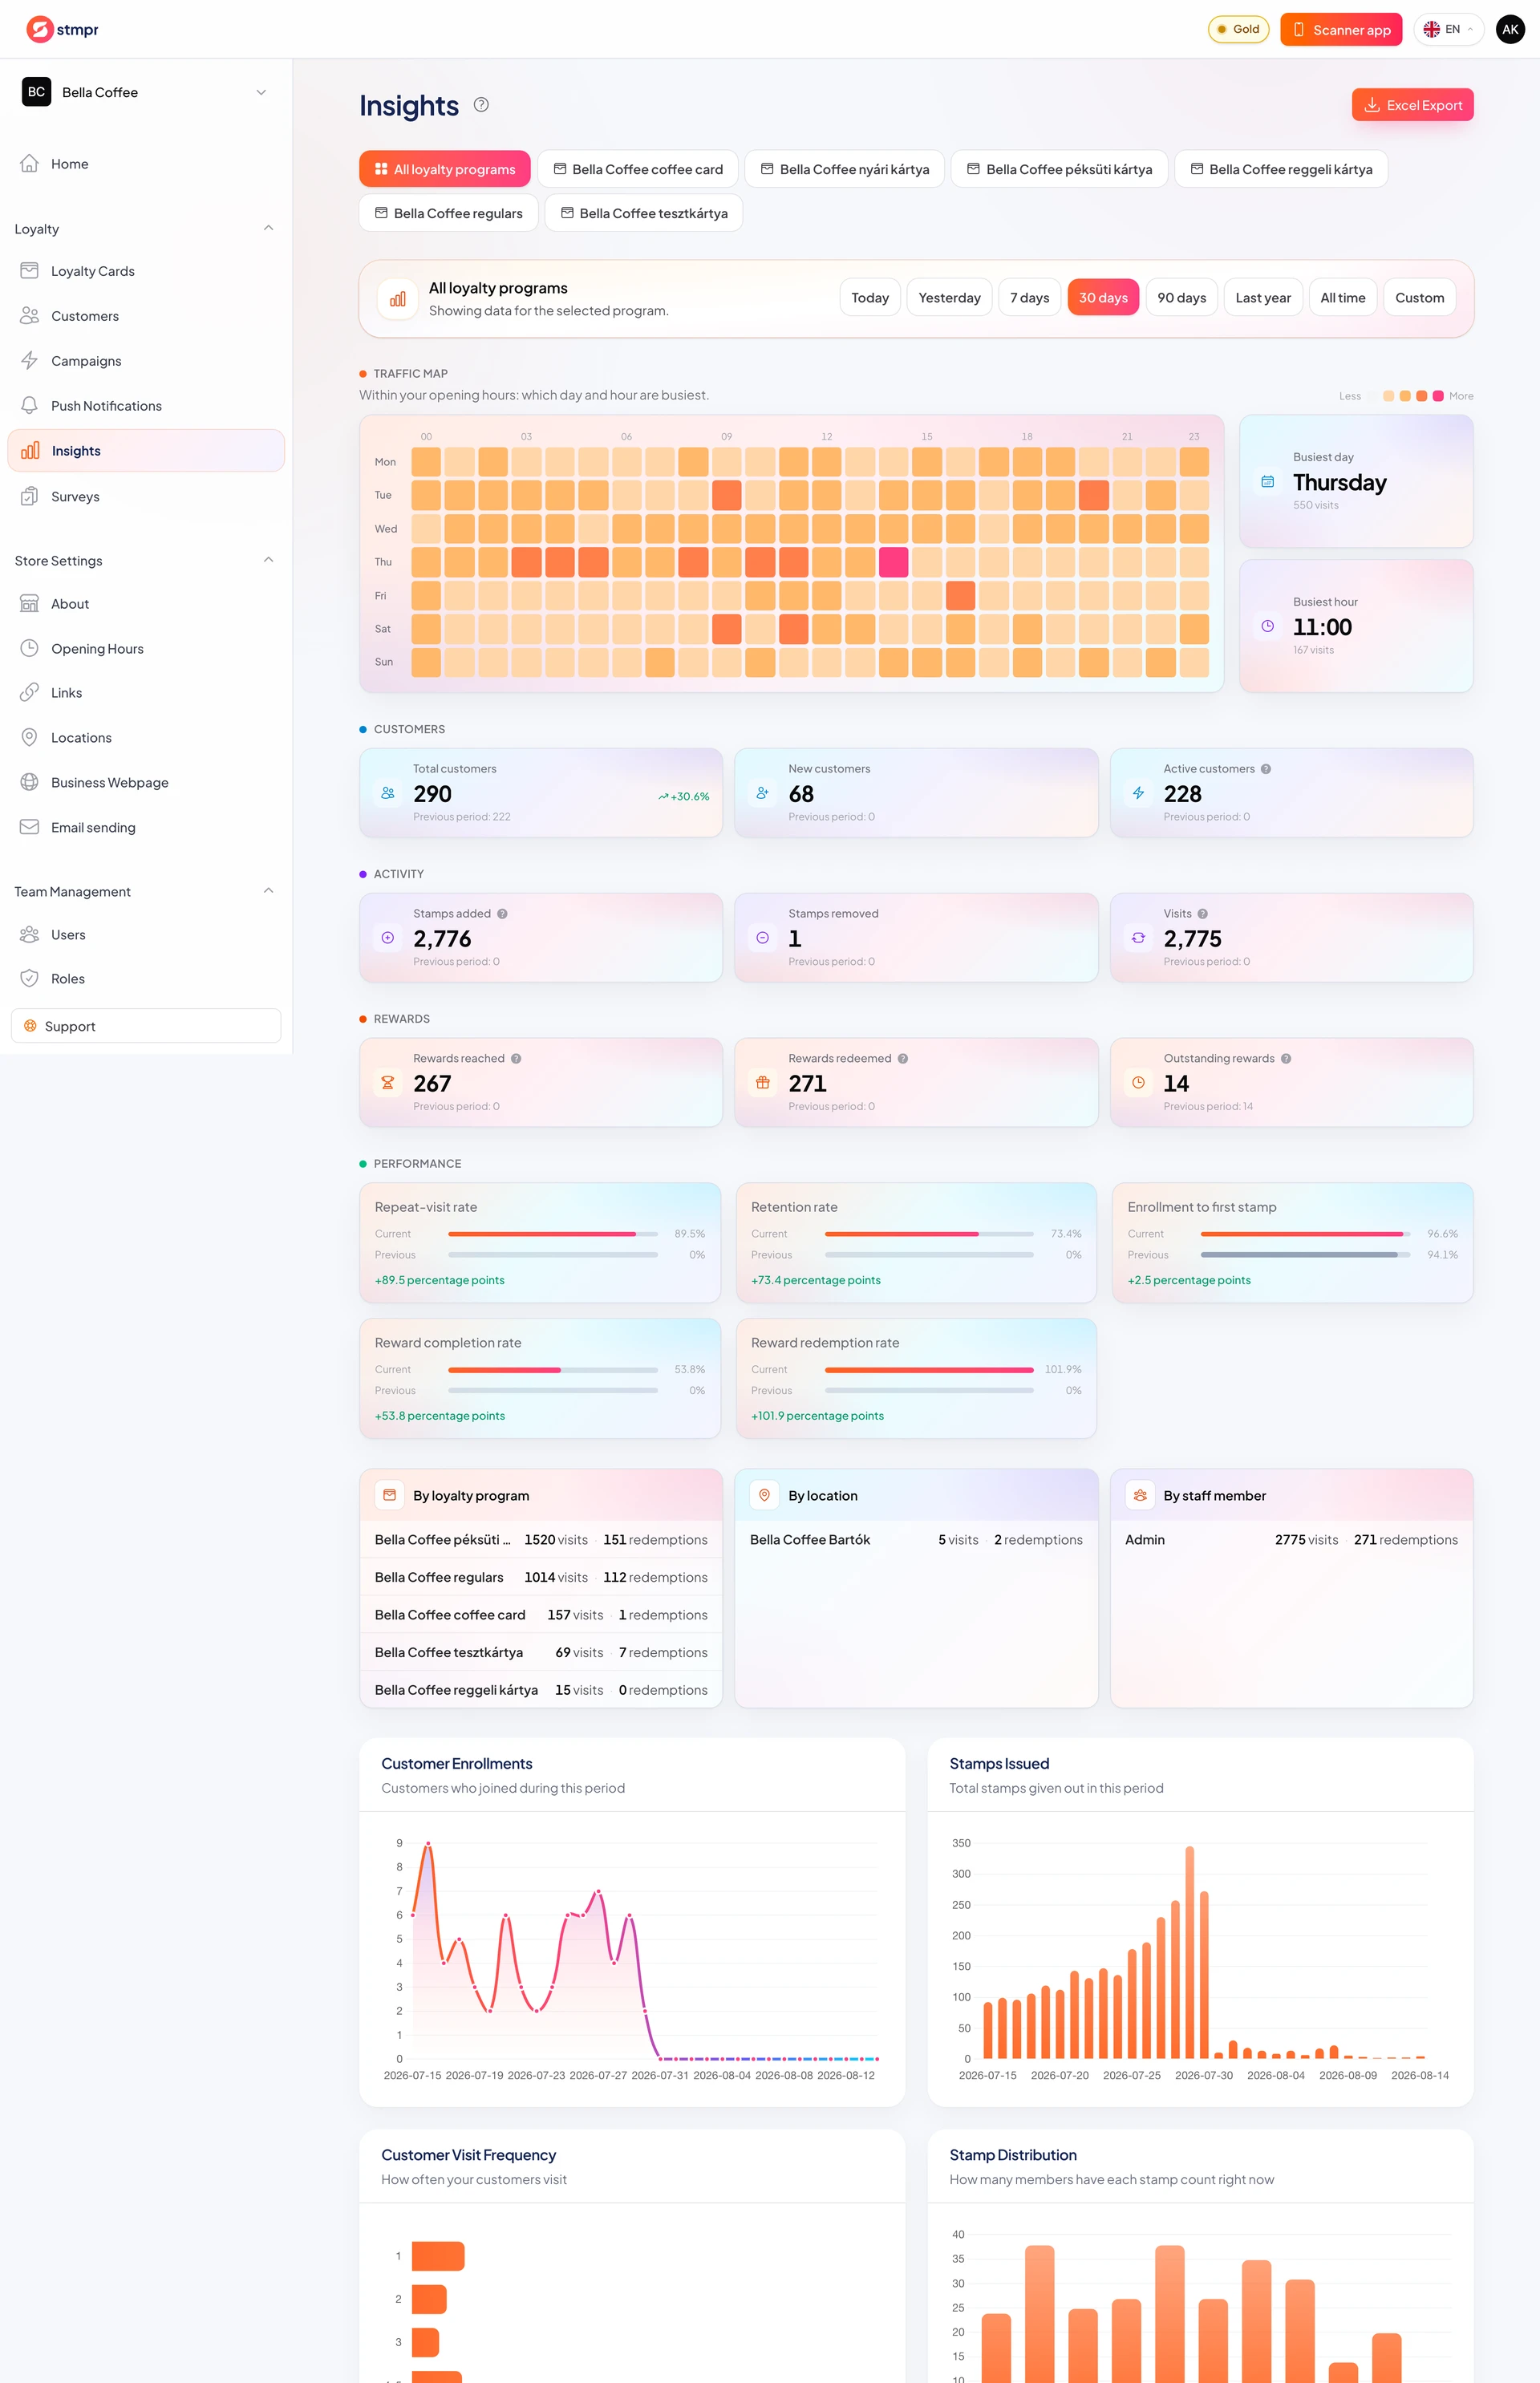
Store Insights show store-wide performance: enrollments, stamps, redemptions, active customers. KPIs and charts highlight trends.
Enough for weekly or monthly review; the top strip is enough for quick decisions.
https://stmpr.io/dashboard/insights
Why use this?
See whether the program grows: enrollments, stamps, redemptions over time.
Switch periods (7/30/90 days) to spot seasonality.
KPIs inform push timing and reward tweaks.
Step by step
- Open Insights.
- Choose a period: today, yesterday, 7 / 30 / 90 days, last year, all time, or a custom date range.
- Read KPI cards: customers, stamps, redemptions, enrollments.
- Scroll to charts for trends, and to the busy-hours heatmap to see when guests actually come in. The heatmap and the other detailed analytics need a paid plan.
- Compare to prior period when available.
- Export XLSX (plan permitting) for deeper analysis.